Wednesday, August 30, 2017
Wednesday, June 14, 2017
Dynamic Networks: Visualizing Arms Trades Over Time
I previously made some network graphs of Middle East country relationships here using Slate's Middle East Friendship Chart. I was thinking of a way to visualize these relationships (and possibly other ones) with more rule based and objective measure over time. What kind of public dataset could show countries relationships accurately?
I used weapons / arms trades between nations to explore these relationships. I think arms trades are a good indicator of how friendly countries are together because 1) countries won't sell to enemies and 2) if a country wants to befriends country, buying weapons are a good way to do buy influence.
One can also explore other relationships. Below is a graph of relationships of the world in 1960. There is a Russia/ Soviet Union cluster and a US / Western Europe Cluster. Neat!

I used weapons / arms trades between nations to explore these relationships. I think arms trades are a good indicator of how friendly countries are together because 1) countries won't sell to enemies and 2) if a country wants to befriends country, buying weapons are a good way to do buy influence.
SIPRI has a very detailed dataset of international arms transfers between >257 nations / organizations in the post war era. The include a type / description and quantity for all trades. For this analysis I will use only the fact that two countries bought or sold some weapons for a particular year.
One can create adjacency matrices from this dataset and make some network plots. However, doing this one year at a time will not create have a smooth plots over time. I decided to use siamese network graphs to embed a country indicator and year variable in two dimensions with the response variable being whether or not countries traded arms in that particular year. This will transform the country and year of a country into a 2 dimensional space, and means if two points are near each other they probably traded in that particular year.
You can check out the graph here. It's cool that we can see Iran moving away from US to Russia / Soviet Union around 1979 while Egypt and Iraq move towards US.
You can check out the graph here. It's cool that we can see Iran moving away from US to Russia / Soviet Union around 1979 while Egypt and Iraq move towards US.
One can also explore other relationships. Below is a graph of relationships of the world in 1960. There is a Russia/ Soviet Union cluster and a US / Western Europe Cluster. Neat!

Analysis was done in python (using the Keras example for siamese network) and R (for plotting).
Tuesday, January 10, 2017
Will it Sell?
The Lexus LC 500 has been introduced to much acclaim by car reviewers. Of notes are the cars decent steering, optional V-8 powertrain, and handling that borders on sports car rather than grand coupe. However, is there enough of a market for the Lexus to sell it's desired 4800 cars a year?
To find out I produced a time series plot of yearly sales by probable competitors (thinking luxury coupes costing ~$100k. Of course these cars might appeal to different customers, but all can be bought by the same luxury seeking demographic (I'm think LA or Hamptons). Also included is the previous version of Lexus' luxury coupe, the SC.
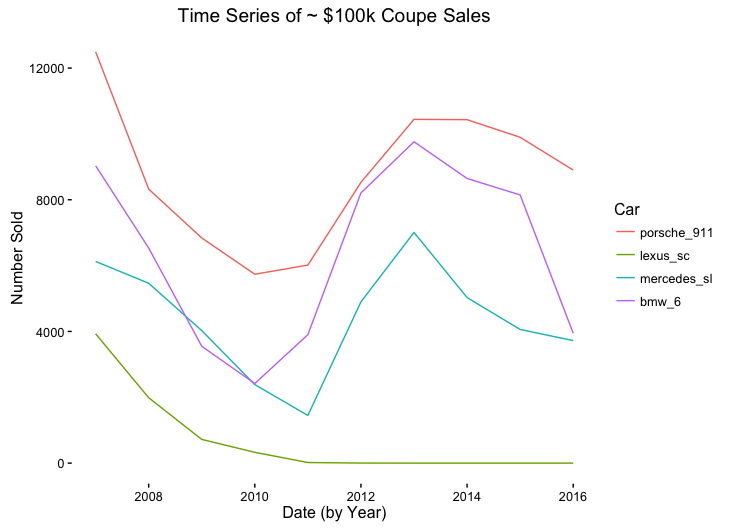
(The general trends of competitors are similar in that they appear to be correlated with the economic environment of the time.)
A dated and underwhelming car Lexus SC sold just under 4000 cars in 2007 and dropped off after that. It seems reasonable that if Lexus followed the script on a plush and luxurious coupe / convertible (think SL500 competitor) it could conceivably come up with 5000 cars a year which is approximate number of cars sold for the 3 competitors displayed, at least in its first years when its still new.
However, Lexus did not follow the script of luxurious convertible that might appeal to its standard base but created a car exciting and involving, more 911 than SL500. Would the traditional Lexus SC buy want a Lexus CS? I doubt it. The CS seems like a drivers car and the SC was not. So previous sales of SC might not be a great indicator of future sales.
More worrying for sales is that the Lexus does not have a convertible at the moment (although there is a concept). It seems hard to sell that many cars in this market without a convertible as all competitors do.
It probably won't come close it its 4800 cars a year but sales probably aren't the point of this car. It probably will bring some much needed cred into the auto enthusiast community. What this car is then, is a halo car.
To find out I produced a time series plot of yearly sales by probable competitors (thinking luxury coupes costing ~$100k. Of course these cars might appeal to different customers, but all can be bought by the same luxury seeking demographic (I'm think LA or Hamptons). Also included is the previous version of Lexus' luxury coupe, the SC.
(The general trends of competitors are similar in that they appear to be correlated with the economic environment of the time.)
A dated and underwhelming car Lexus SC sold just under 4000 cars in 2007 and dropped off after that. It seems reasonable that if Lexus followed the script on a plush and luxurious coupe / convertible (think SL500 competitor) it could conceivably come up with 5000 cars a year which is approximate number of cars sold for the 3 competitors displayed, at least in its first years when its still new.
However, Lexus did not follow the script of luxurious convertible that might appeal to its standard base but created a car exciting and involving, more 911 than SL500. Would the traditional Lexus SC buy want a Lexus CS? I doubt it. The CS seems like a drivers car and the SC was not. So previous sales of SC might not be a great indicator of future sales.
More worrying for sales is that the Lexus does not have a convertible at the moment (although there is a concept). It seems hard to sell that many cars in this market without a convertible as all competitors do.
It probably won't come close it its 4800 cars a year but sales probably aren't the point of this car. It probably will bring some much needed cred into the auto enthusiast community. What this car is then, is a halo car.
Subscribe to:
Posts (Atom)